
Using Data Analytics to Support High- and Low-Performing Schools
/
School districts are inundated with various types of school and classroom performance data – and not all types of data are suitable in understanding how to best provide differentiated supports to schools.
Data analytics such as growth data – or value-added (VA) data – can provide valuable insights into how well the instructional and leadership quality in classrooms or schools “grow” student learning year to year. Attainment data are scores typically used for providing a “snap shot” in time of how much a student has academically achieved as measured by standardized tests.
Combining these two data sources provides an insightful lens on how different types of schools are providing effective supports to teachers and students, and which schools may need additional or differentiated supports to improve or sustain their instructional efforts. In a study of 8 schools in Milwaukee Public Schools (MPS), we selectively sampled schools that varied across achievement and value-added scores (Table 1) to find out how different schools engage in data use practices (Kraemer, Geraghty, Lindsay, and Raven, 2010).
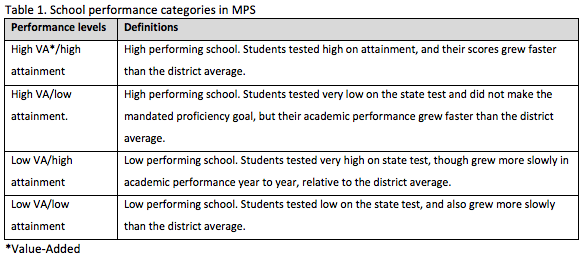
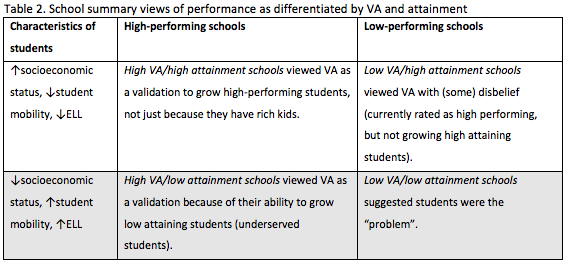
Two schools within each category were sampled and school-site interviews with teachers and principals were conducted to understand how they viewed their students, instructional quality, and leadership quality in schools (Table 2).
High- and low-performing school personnel showed some key differences in their approach to data use for school and classroom performance management. For example:
High-performing schools articulated a “culture of data use and mindset of student growth” while low-performing schools focused on behavior rather than academic performance.
High-performing schools emphasized learning team collaboration and representation of various school leaders and teachers. These teams met on a regular basis to discuss and plan for specific goals.
Low VA/low attainment schools did not demonstrate this level of focus or team cohesion: Their meeting did not include an agenda, discussion of data or improvement planning, or plans for ongoing meetings and work. In one learning team session in a high VA/low attainment school, the team struggled to interpret short-term reading assessment data and formulate a coherent strategy.
While not a generalizable study, these preliminary findings provide transferrable practices to use in districts and schools. Identifying the schools that are high performing using VA, then differentiating on their level of attainment provide insights on the types of supports needed for each school. Schools that score higher on VA grow students regardless of where students start academically. This is especially important for schools with students that score lower on attainment because it shifts the perception of how well the school is actually performing. Low attainment/low VA scoring schools can look to their demographic counterparts in other schools who are growing students in VA to find out what kinds of culture, mindsets, and data practices they are using to find gains.
District administrators can use these two types of data in tandem to understand patterns of performance across the schools in their districts. Using the lens of high/low growth (VA) versus high/low attainment (achievement scores) can help to stratify and further craft how school-based supports are delivered and utilized a cross a district (e.g., professional development practices on data use).
Reference
Kraemer, S., Geraghty, E., Lindsey, D., & Raven, C. (2010). School leadership view of human and organizational factors in performance management: A comparative analysis of high- and low-performing schools. Proceedings of the Human Factors and Ergonomics Society Annual Meeting, 54(17), 1287-1291. https://doi.org/10.1177/154193121005401705